The Candlestick Trough is a technical analysis pattern used to identify potential buying opportunities in financial markets. It signals a shift in market sentiment from bearish to bullish, indicating a potential reversal of a downtrend. Understanding this pattern can help traders make informed decisions and potentially capitalize on upward price movements.
What is a Candlestick Trough?
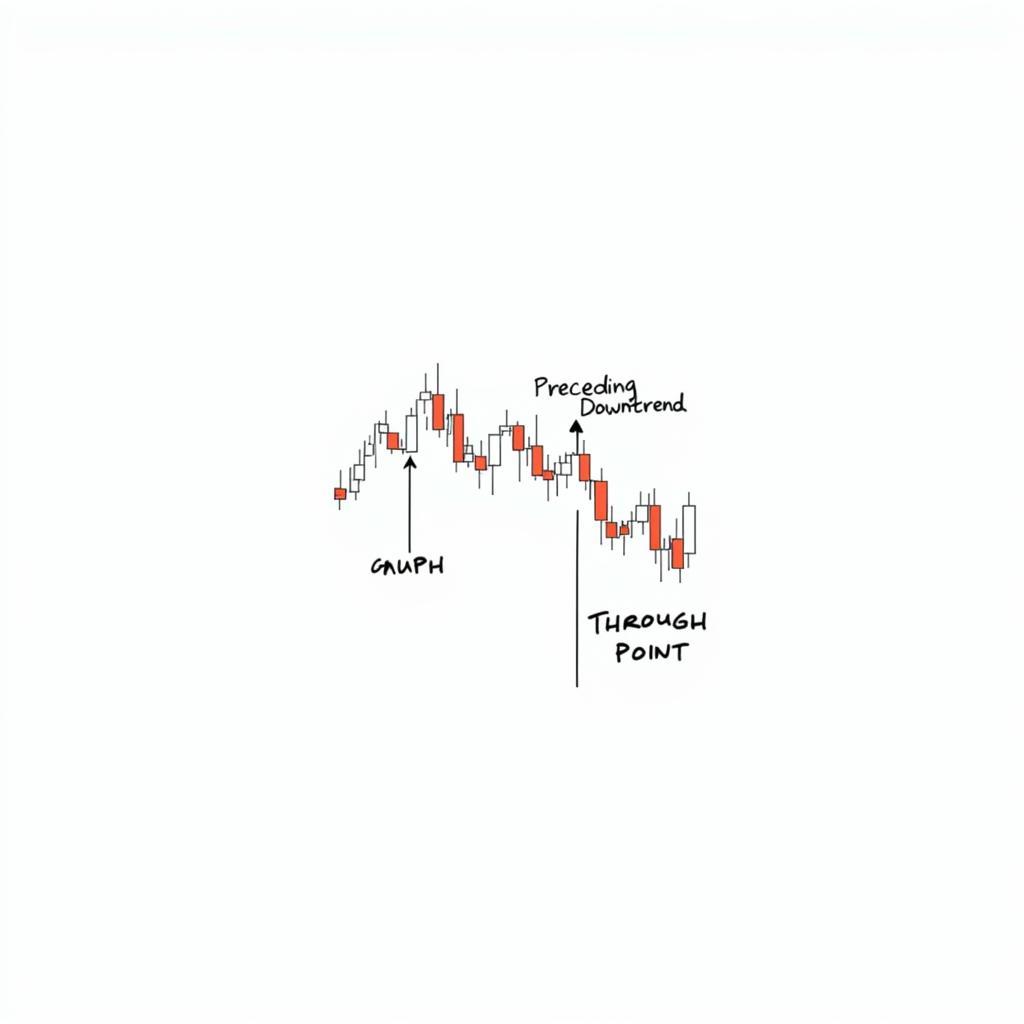 Candlestick Trough Formation
A candlestick trough, sometimes referred to as a “trough pattern,” is characterized by a series of candlesticks that form a visual “U” shape on a price chart. This pattern typically occurs after a period of downward price movement, suggesting a slowdown in selling pressure and a potential shift towards buying pressure.
The formation typically involves:
- Downtrend: A preceding downtrend, indicating a period of sustained price decline.
- Trough Candle: A candlestick with a lower low than the preceding candles, marking the bottom of the trough. This candle often has a long lower shadow, indicating rejection of lower prices.
- Uptrend: A subsequent uptrend, signifying a potential reversal and the beginning of a new bullish trend.
Identifying and Trading the Candlestick Trough
Traders often look for specific characteristics to confirm the validity of a candlestick trough pattern:
- Volume: Increased trading volume during the formation of the trough candle and the subsequent uptrend adds credibility to the bullish signal.
- Confirmation Candles: The presence of one or more bullish candlesticks following the trough candle strengthens the signal, indicating buying pressure is building.
- Support Levels: The trough candle finding support at a significant technical level, such as a previous low or a moving average, further validates the pattern.
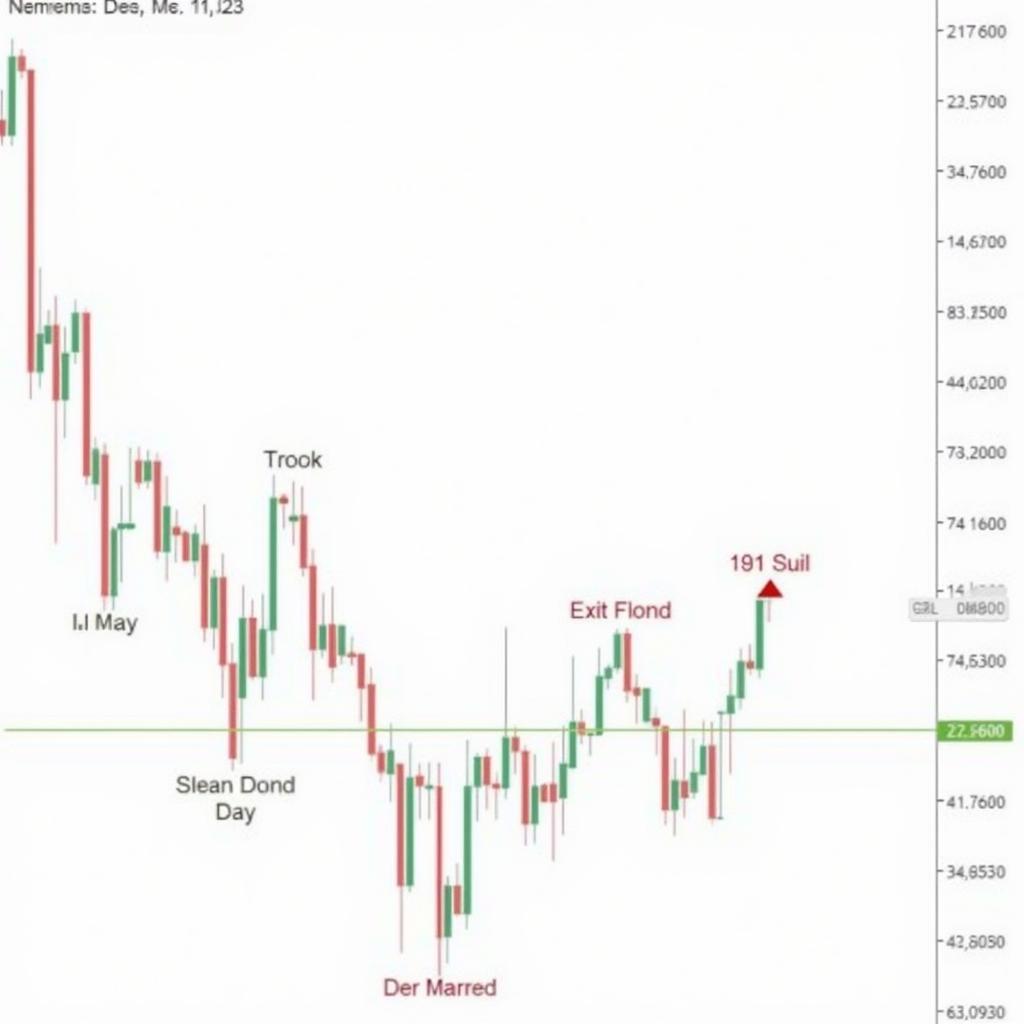 Trading the Candlestick Trough
Traders may consider entering a long position when the price breaks above the high of the trough candle, placing a stop-loss order below the low of the trough. The profit target can be determined based on other technical indicators or price targets.
Candlestick Trough vs. Double Bottom
While both the candlestick trough and the double bottom pattern share a similar “U” shape, they differ in their formation and interpretation.
- Formation: The double bottom pattern consists of two distinct lows at roughly the same price level, while the candlestick trough focuses on the overall “U” shape formed by a series of candlesticks.
- Timeframe: Double bottoms typically form over a longer period, while candlestick troughs can occur on shorter timeframes.
Limitations of the Candlestick Trough
It’s crucial to understand that the candlestick trough, like any technical analysis pattern, has its limitations:
- False Signals: Not all candlestick troughs lead to a trend reversal. False signals can occur, leading to potential losses.
- Subjectivity: The interpretation of candlestick patterns can be subjective, and what one trader considers a valid trough, another might not.
Conclusion
The candlestick trough can be a valuable tool for traders looking to identify potential bullish reversals. However, it’s essential to use this pattern in conjunction with other technical indicators, risk management strategies, and a thorough understanding of market conditions. Remember, no technical analysis pattern guarantees profits, and careful consideration should always be given before making trading decisions.
For any assistance with your trading journey or for personalized insights, our team of experts is available 24/7. Contact us at Phone Number: 0902476650, Email: [email protected] or visit our office at 139 Đ. Võ Văn Kiệt, Hoà Long, Bà Rịa, Bà Rịa – Vũng Tàu, Vietnam.